Reduce unnecessary water, energy, chemical use, and cleaning time through measured CIP performance and targeted process improvements. We analyse existing cycles, refine recipes and end-point logic, and verify the cleaning result against agreed hygiene and product-safety criteria.
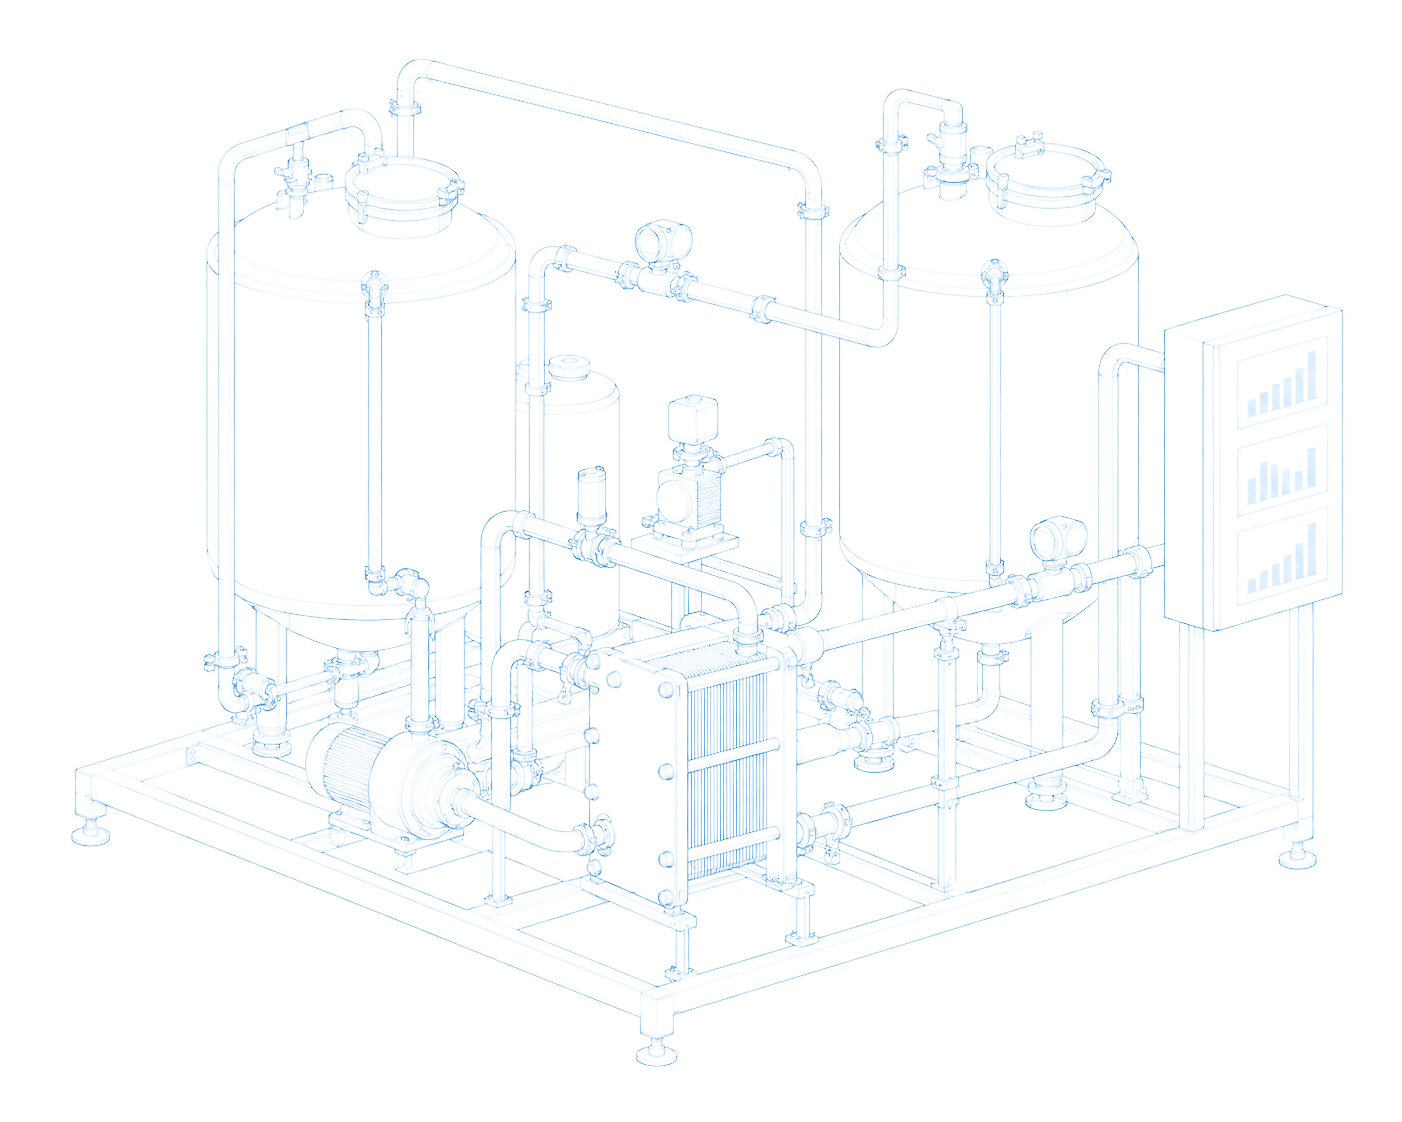

WHAT IS CIP PROCESS OPTIMIZATION
CIP Process Optimization is a structured engineering and hygiene service for existing CIP stations and cleaning processes. We combine CIP cycle optimization and CIP recipe optimization with analysis of cleaning objects, product soils, allergens, circuits, process trends, and production constraints. Findings guide setpoints, phase transitions, and CIP endpoint optimization, including opportunities for CIP water reduction where the required cleaning result remains verified.
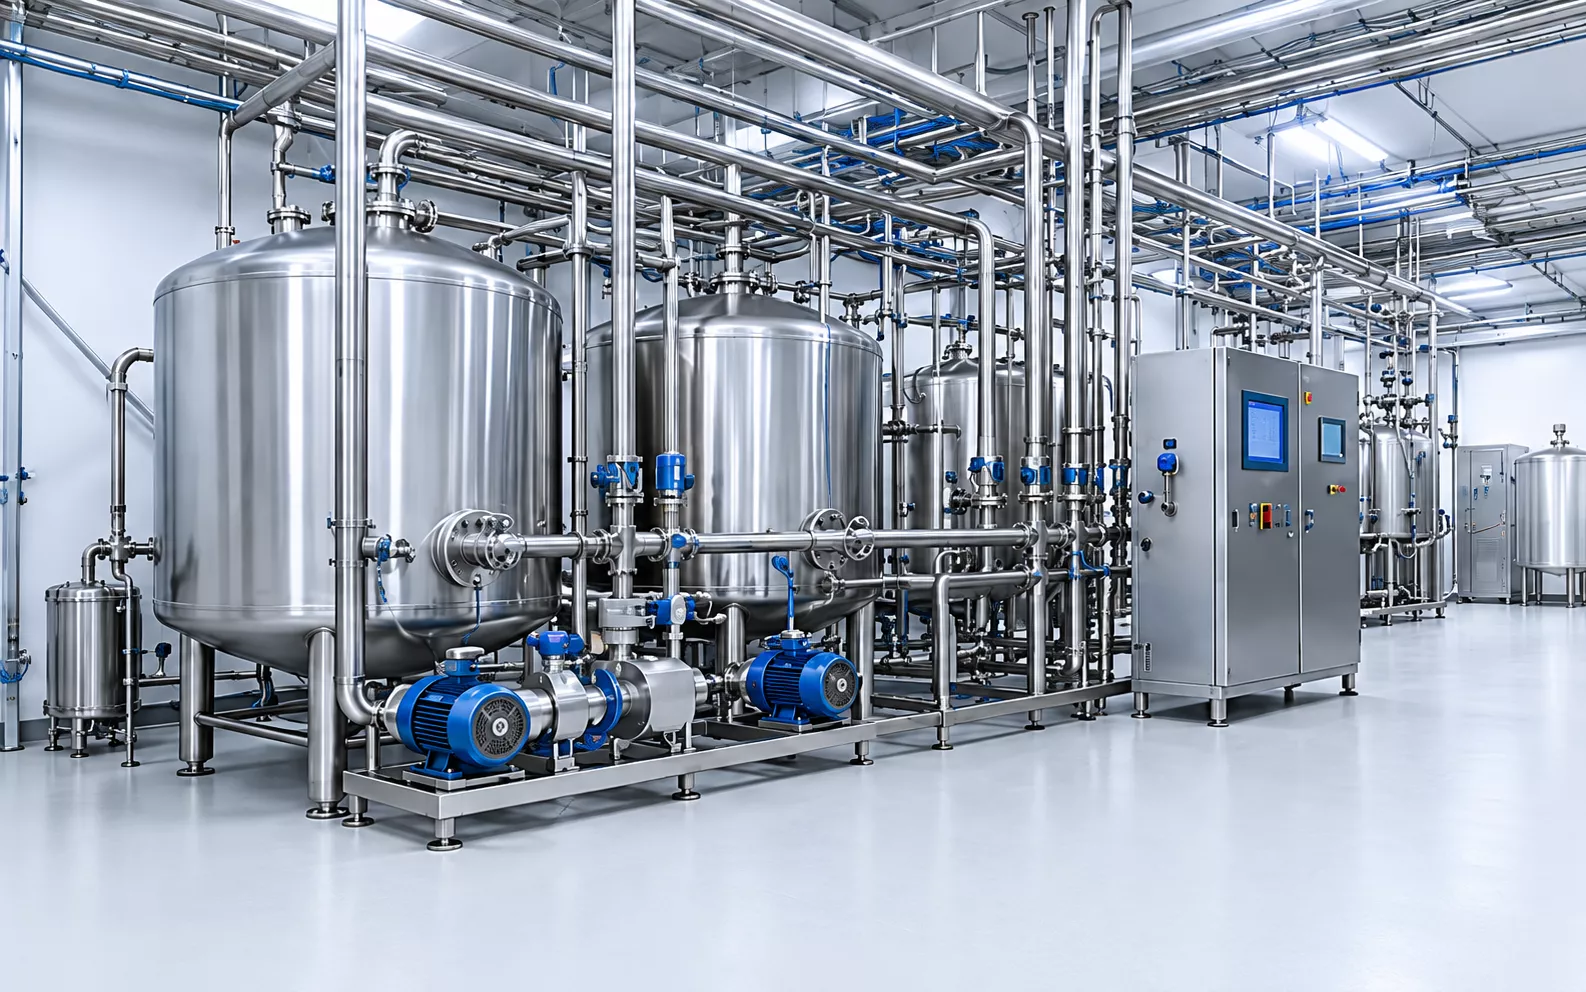

OPTIMIZATION OUTCOMES
Existing recipes may reflect commissioning assumptions or years of local adjustments. Some phases run longer than needed, while others may fail to achieve the required cleaning conditions. Optimization establishes what each object and product actually requires, identifies avoidable losses, and tests proposed changes against agreed acceptance criteria.
WHEN THIS SERVICE IS NEEDED
01
Consumption is increasing, but the plant cannot identify which cleaning objects, recipes, or phases account for the losses.
02
CIP delays changeovers, restricts production capacity, or creates scheduling conflicts between objects sharing the station.
03
Changes in product composition, viscosity, stickiness, or allergen profile require a review of cleaning recipes and validation needs.
04
Rinse and chemical stages rely on conservative time settings with limited evidence that the phase duration matches the cleaning requirement.
05
Repeated cleaning or inconsistent hygiene results call for investigation of process conditions before any reduction in time or resources.
06
The site needs a documented performance baseline, savings case, and prioritised action plan for improvement or investment decisions.
WHAT CAN BE OPTIMIZED
The scope may include recipe parameters, rinse end-points, heating, circulation, chemical dosing, return routing, and recovery. Recommendations are based on measured performance and the cleaning conditions required for each object.
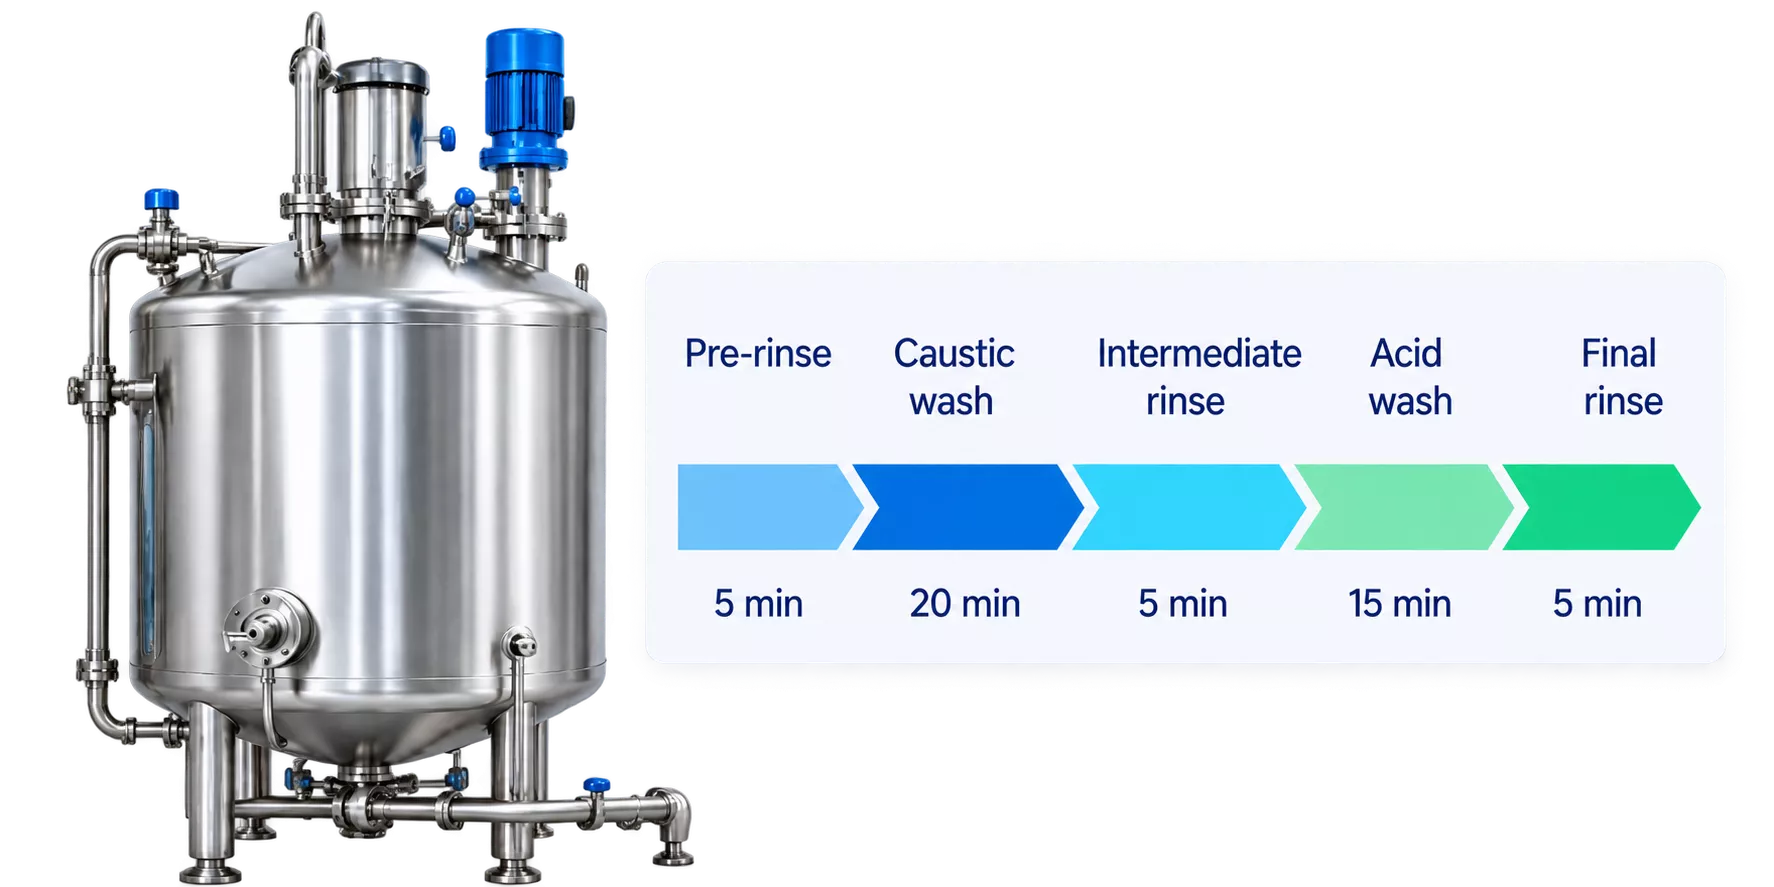
Review phase sequences, exposure times, and safety margins against product soils, cleaning frequency, and verified cleaning requirements.
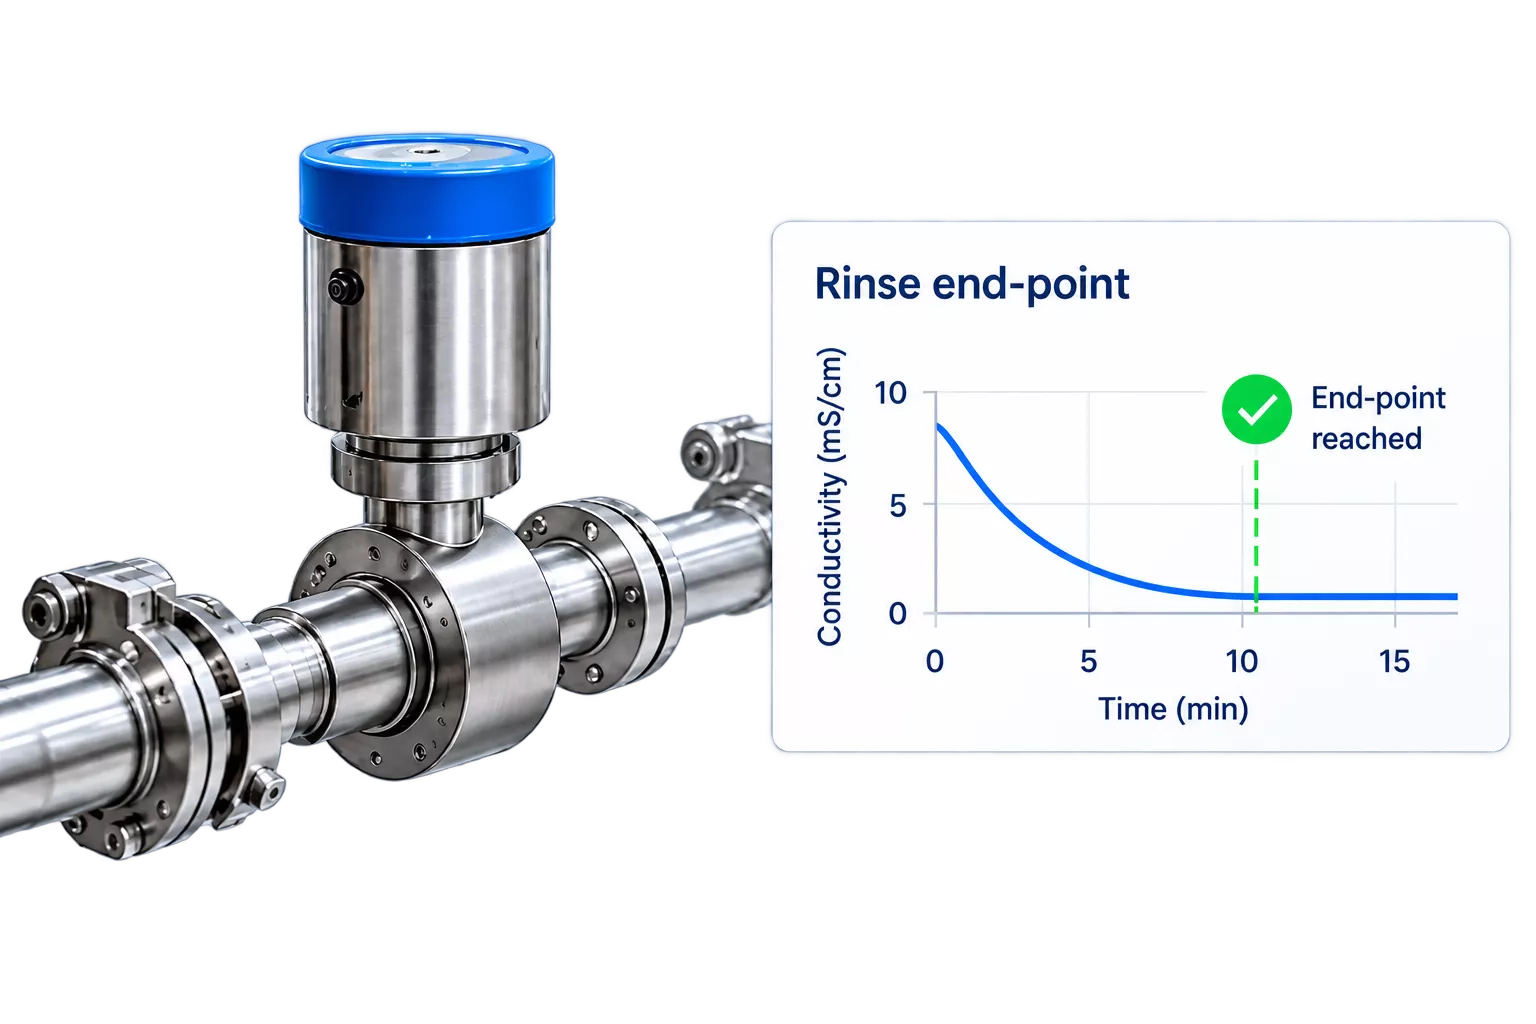
Assess conductivity, turbidity, or other suitable return signals to define rinse end-points and avoid unnecessarily extended rinsing.
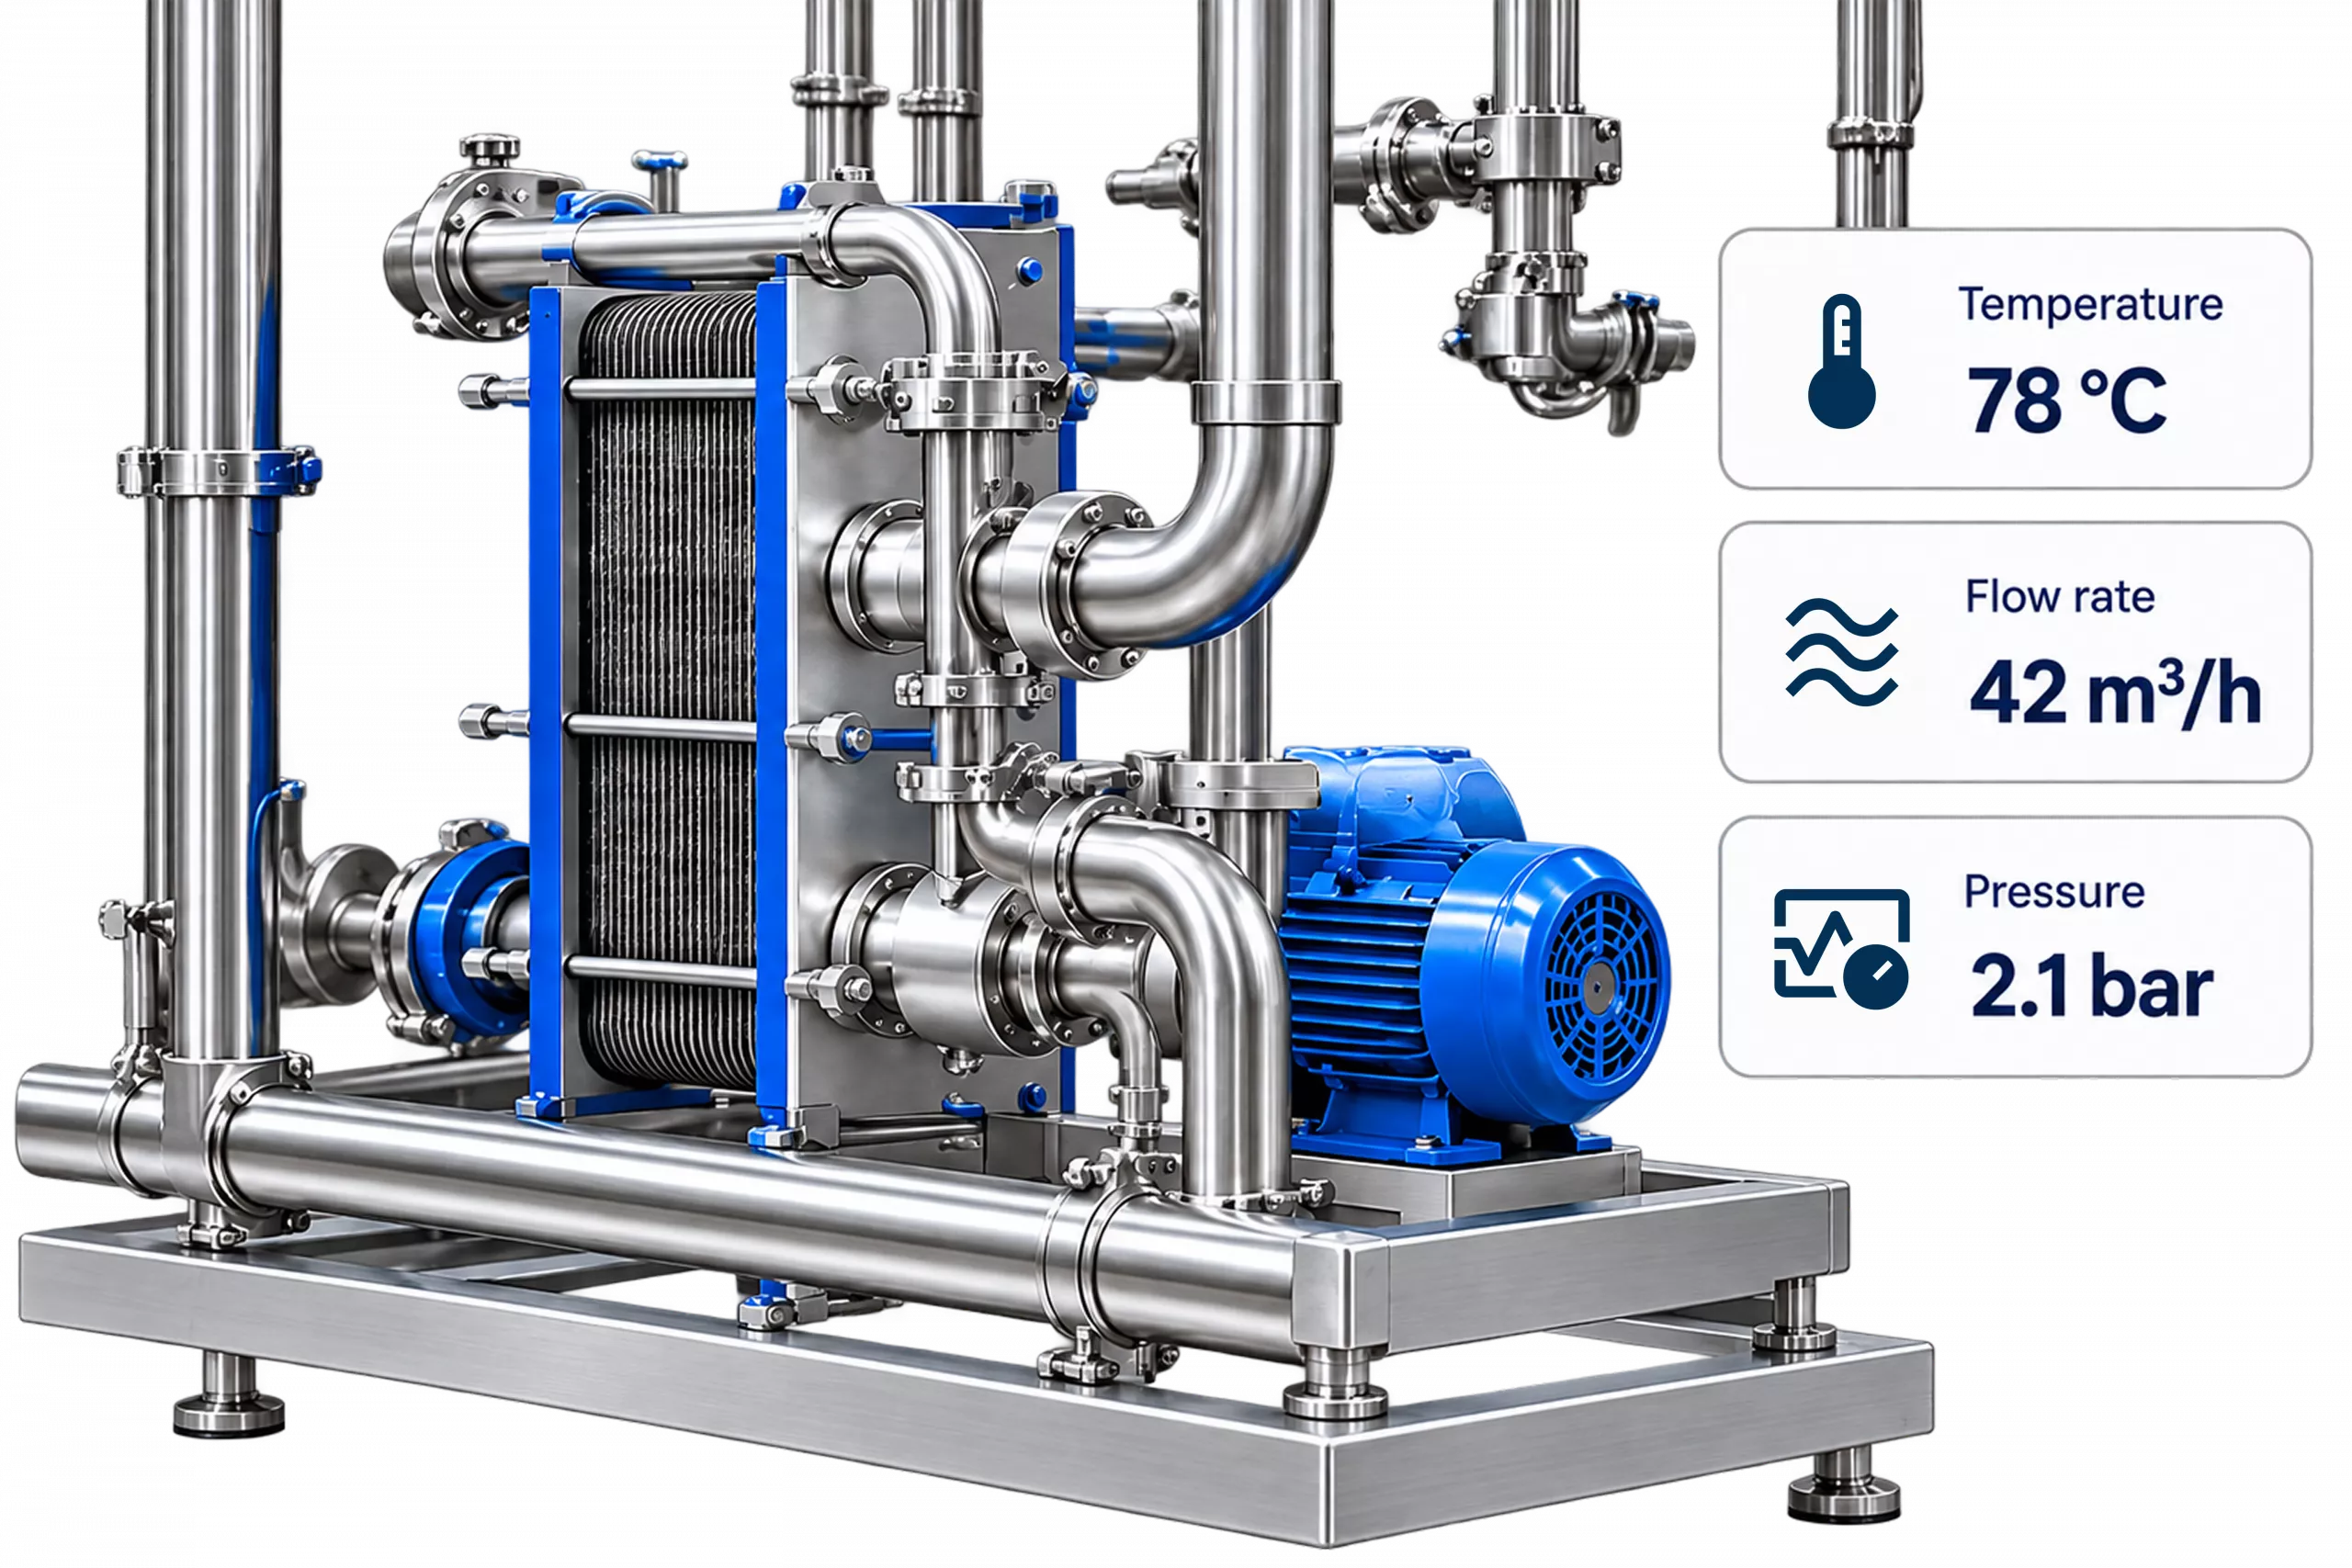
Review temperature profiles, flow, pressure, and pump operation to identify avoidable energy use while maintaining required cleaning conditions.
Improve phase identification and routing to assess where water or cleaning solutions can be recovered, reused, or discharged appropriately.
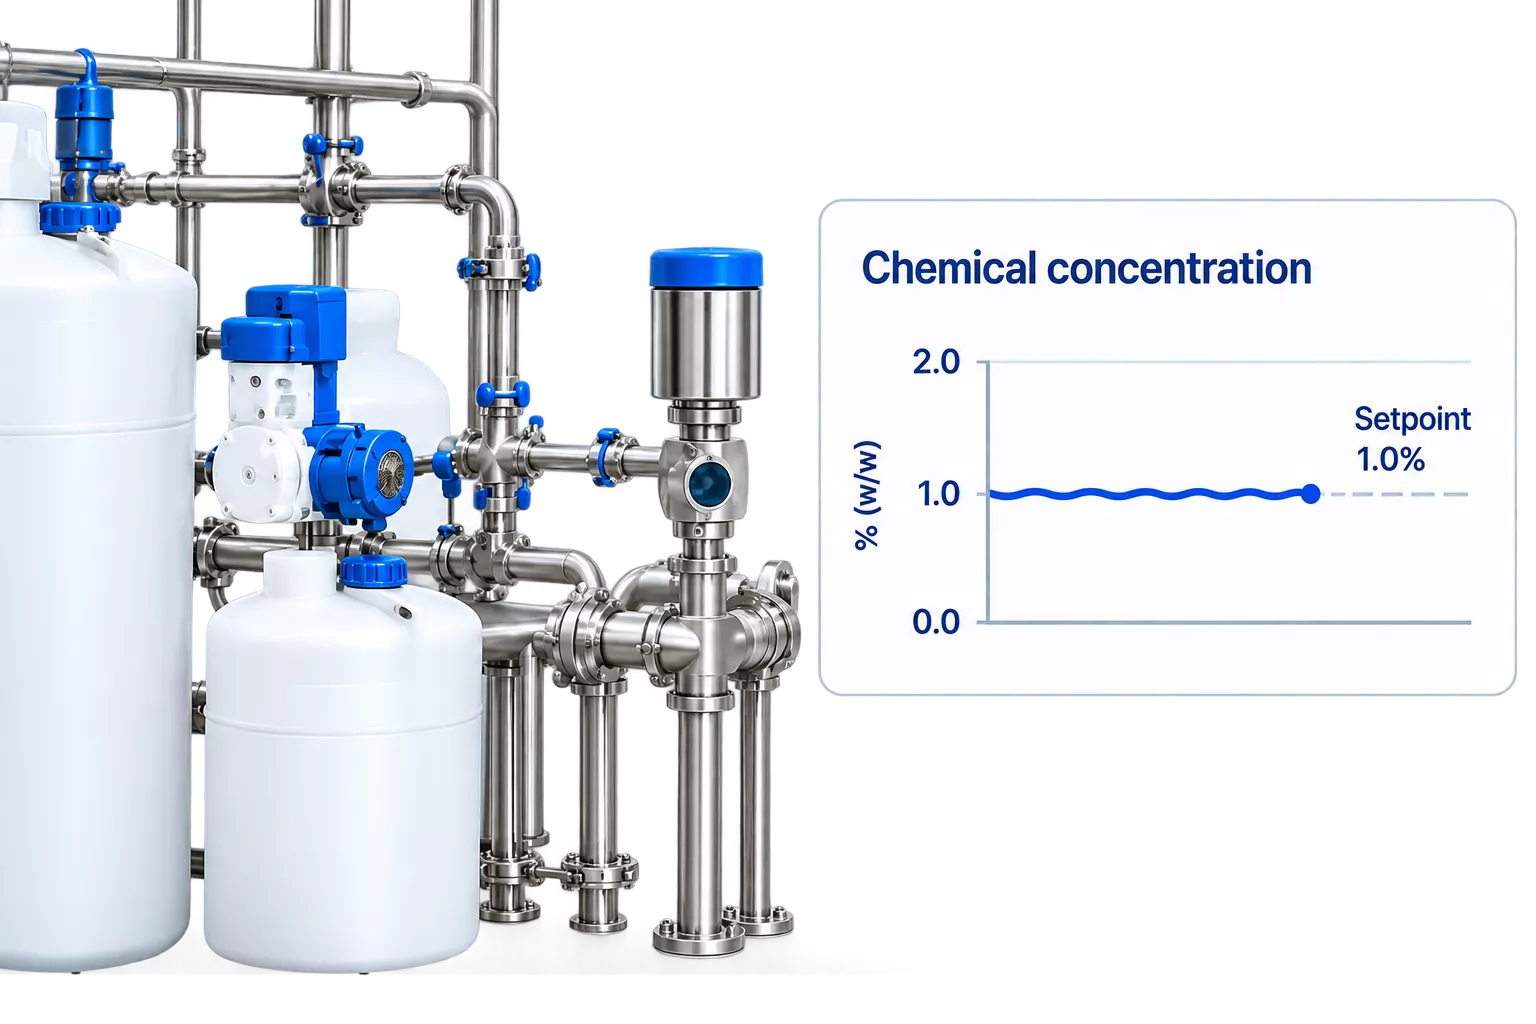
Review concentration measurement, dosing behaviour, replenishment, and carry-over to identify over-dosing and unstable detergent conditions.
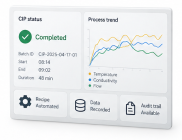
Define cycle and resource KPIs by object and phase. Use available measurements and reports to track changes and identify recurring losses.
SYSTEMS AND COMPONENTS
WHAT WE ASSESS
Review 1 — Recipes, products, and cleaning objects
Review PFDs, P&IDs, recipes, product and allergen data, and production schedules to establish what each circuit must clean and where requirements have changed.
Review 2 — CIP parameters and phase trends
Analyse time, temperature, flow, pressure, conductivity, and concentration to identify unstable conditions, unnecessary margins, and excessive phase duration.
Review 3 — Circuits and hygienic design
Assess dead zones, retained liquid, drainage, seals, and flow paths to identify equipment issues that recipe adjustments alone cannot resolve.
Review 4 — Rinsing and phase transitions
Review representative return signals, rinse quality, and routing to identify over-rinsing, incorrect phase separation, and avoidable discharge of reusable solutions.
Review 5 — Hygiene verification
Select appropriate visual checks, ATP screening, swabs, allergen tests, rinse-water analysis, or coverage tests according to the risk and agreed verification scope.
Review 6 — Consumption and operating costs
Compare water, chemicals, steam, electricity, cycle time, and wastewater data by object and phase. Distinguish estimated opportunities from improvements verified after implementation.
Monitoring
Know exactly what happened in every cleaning cycle — temperature, flow, conductivity, and timing — for every zone in your dairy plant.
Live per-line dashboards showing all critical CIP parameters. Each cleaning line has its own view — operators see exactly what is happening, right now.
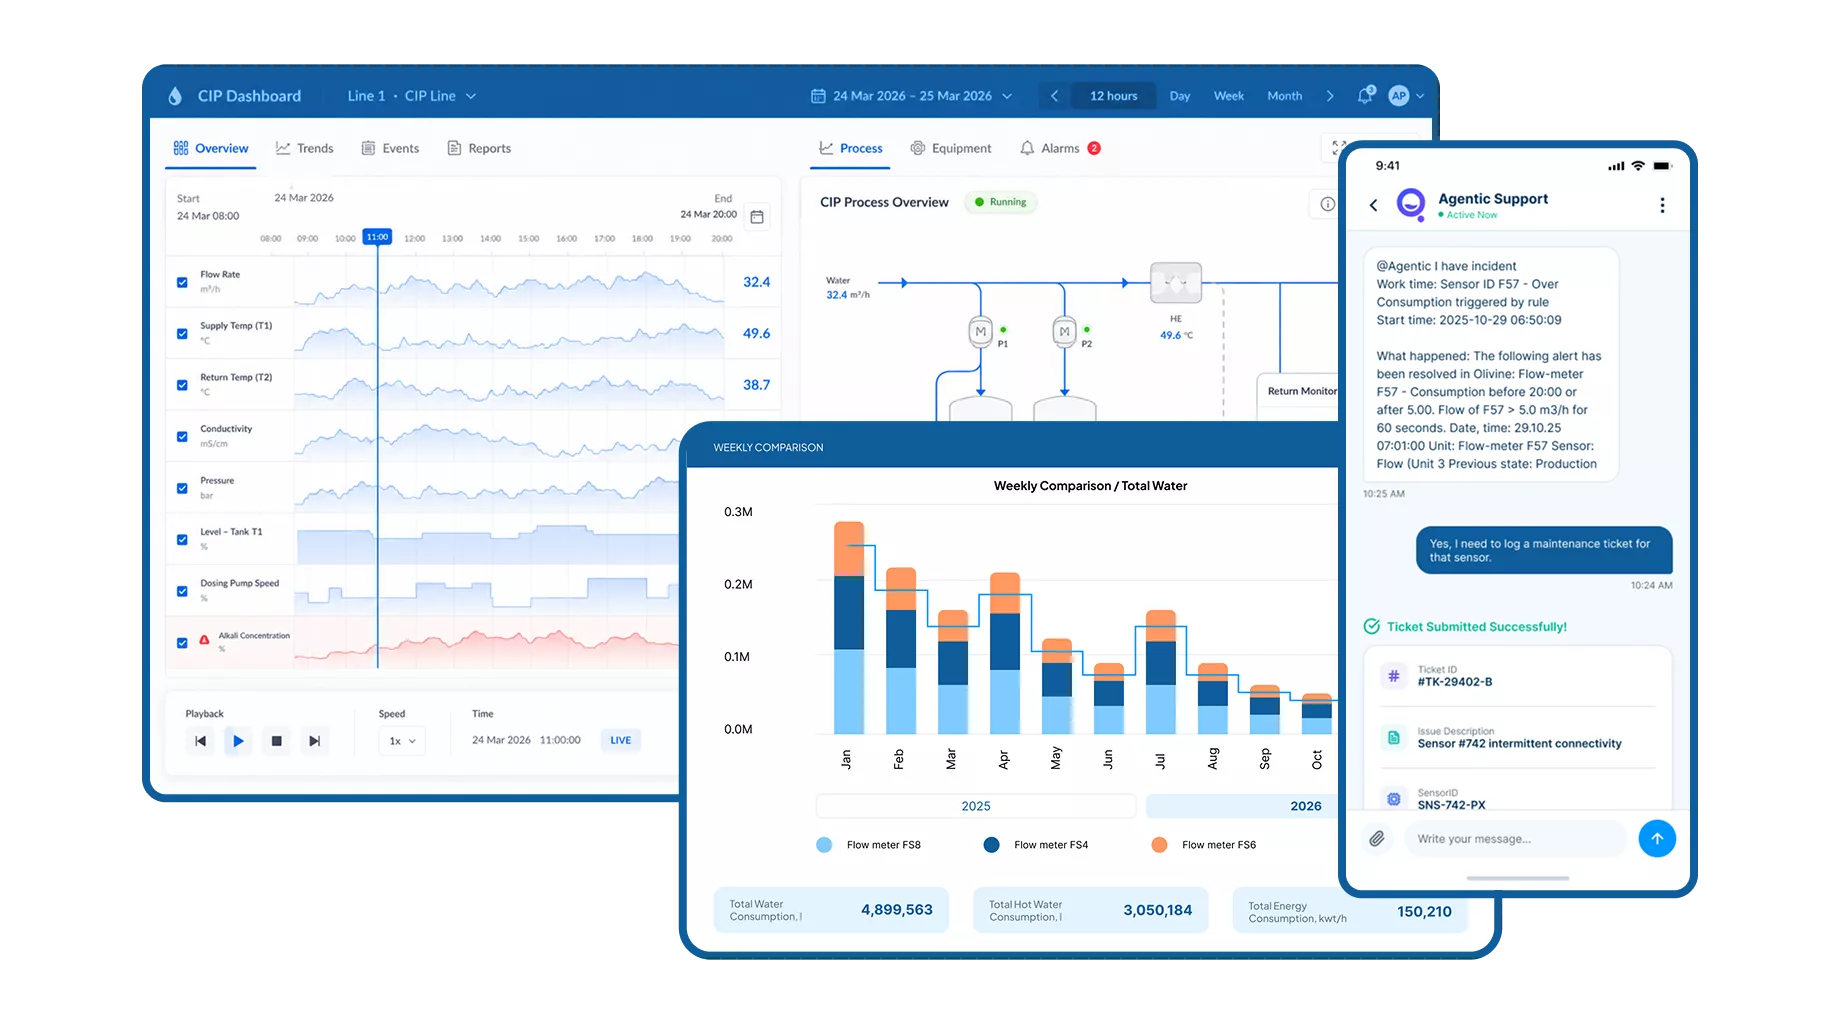
Configurable threshold alerts for every parameter.
Push notifications to operators the moment a deviation occurs — not at the end of the shift.
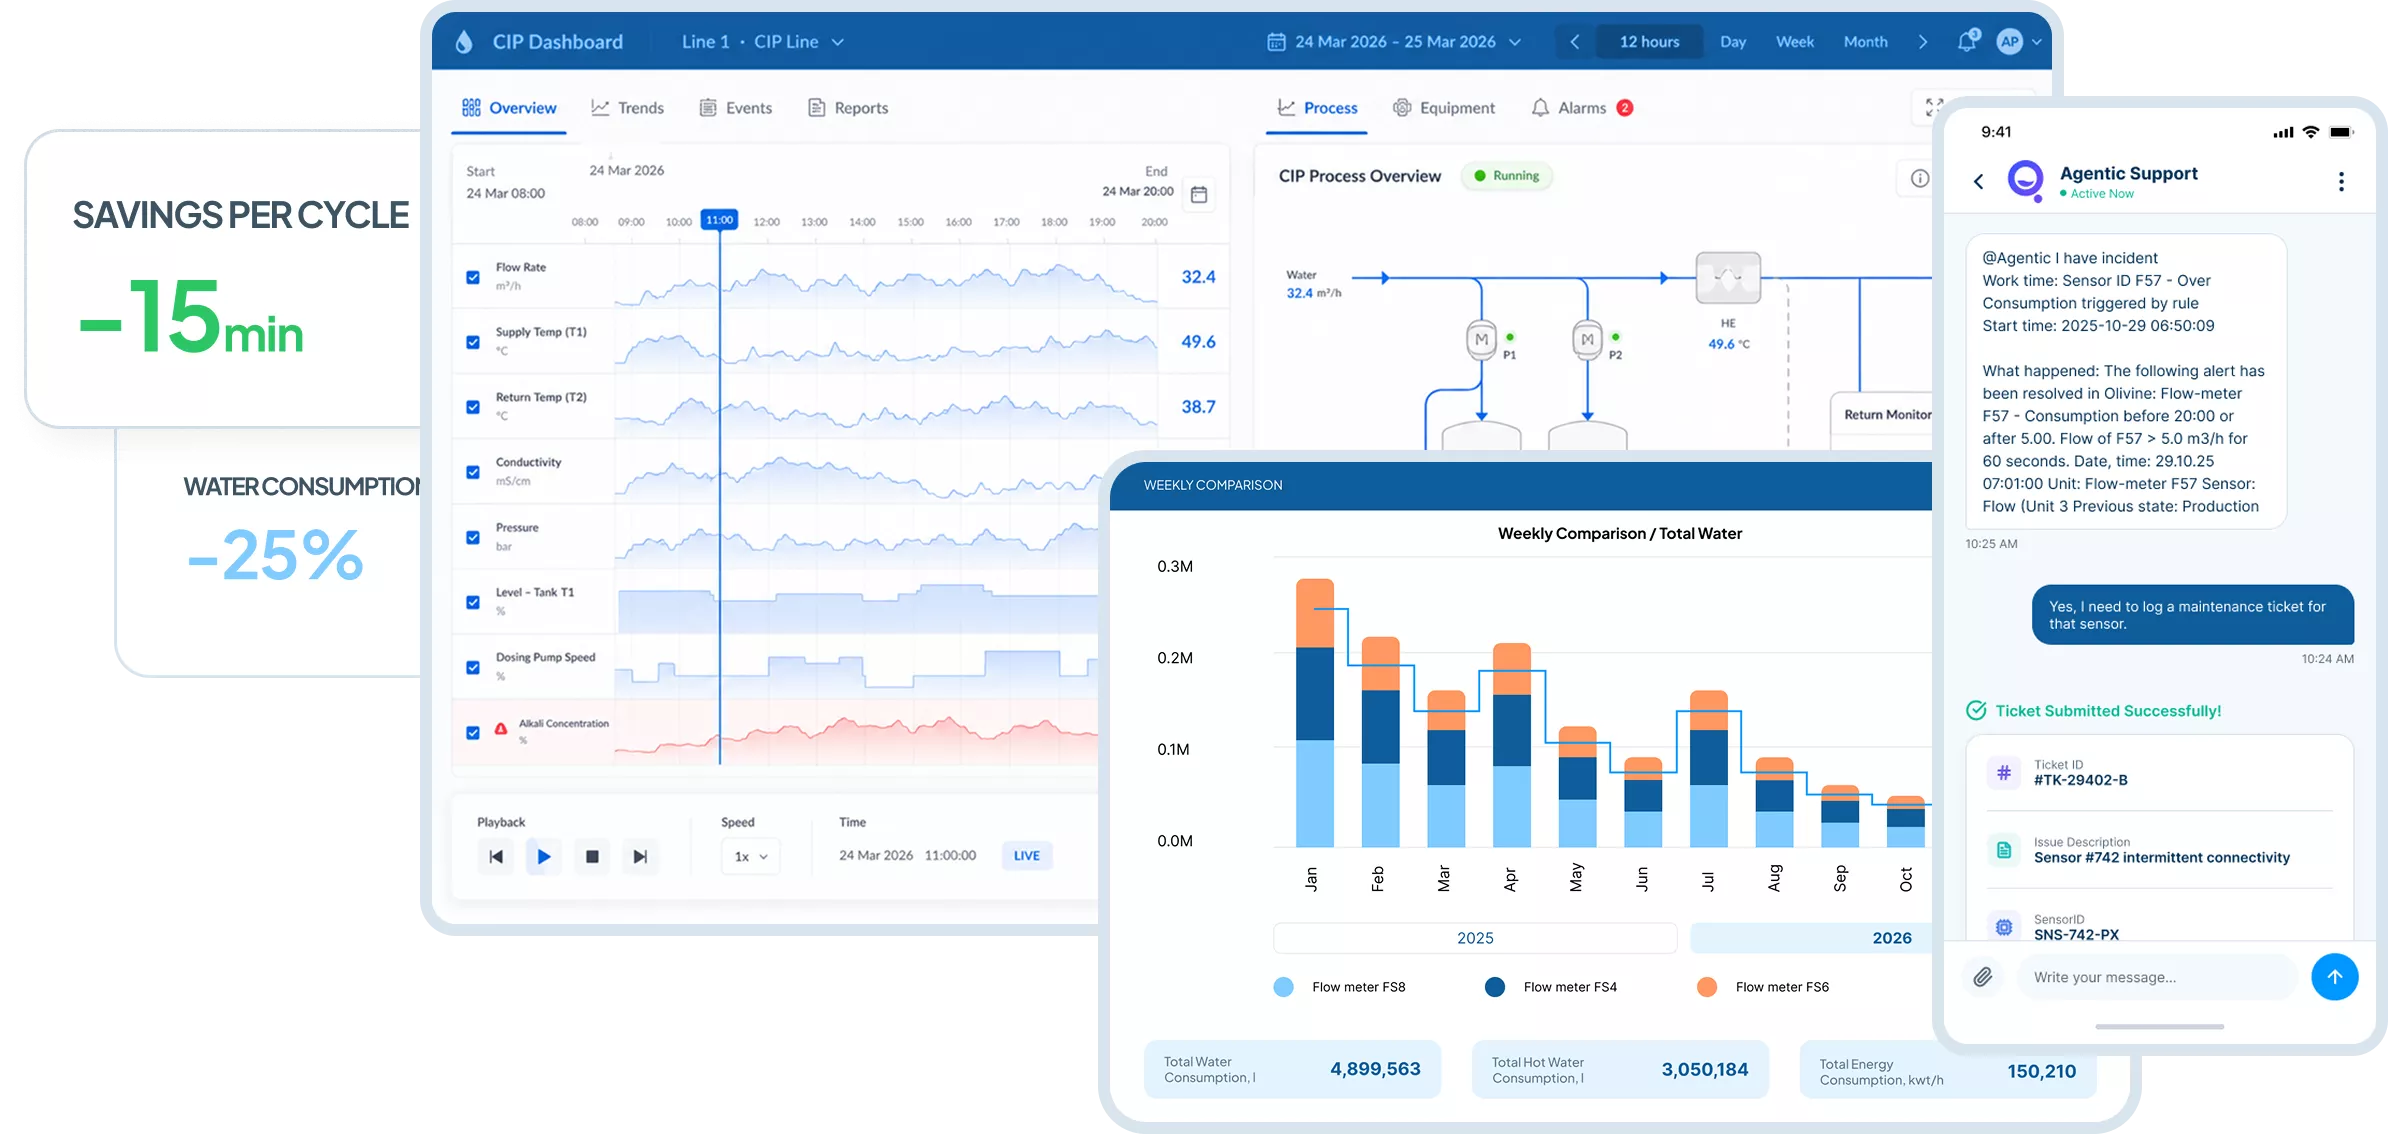
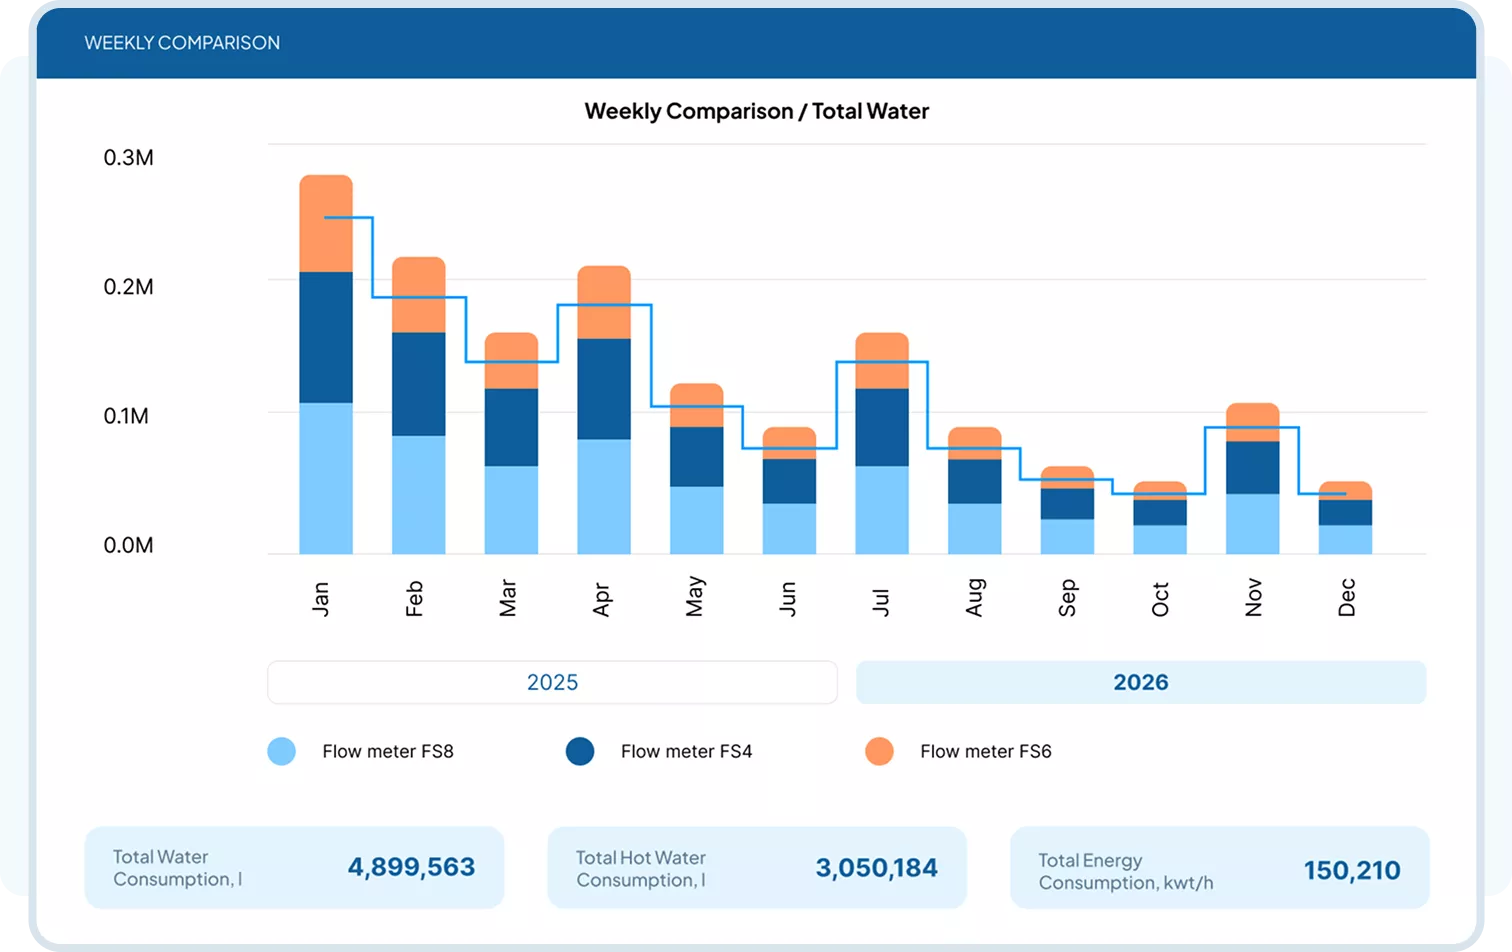
Week-over-week trend data for water consumption, chemical use, cycle time, and energy. Identify where your process is drifting before it becomes a problem.
Optimization Goals
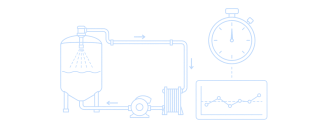
75 min
60 min
Average CIP cycle time
≈15 min saved per cycle
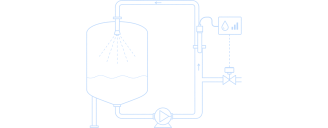
4.0 m³
3.0 m³
Water consumption per cycle
25% decrease
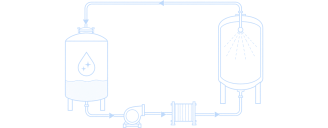
7.0 L
1.15 L
Detergent consumption per cycle
≈6× lower use
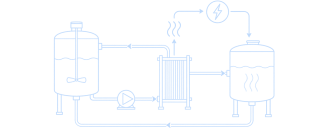
300 kWh
240 kWh
Energy consumption per cycle
−20% Energy consumption
HOW THE SERVICE IS DELIVERED
01
Collect drawings, cleaning-object lists, recipes, utility tariffs, cycle logs, alarms, and hygiene history. Map the existing station and circuits, review qualification evidence, and agree project objectives and acceptance criteria.
02
Connect available process data and define any additional measurement needs. Configure agreed monitoring and reporting to establish cycle-time, resource, and cleaning-performance baselines.
03
Analyse performance by cleaning object and phase. Review time, temperature, flow, concentration, return signals, rinse quality, and utility use to identify losses and improvement opportunities.
04
Document findings, estimated savings, recipe recommendations, and corrective-action priorities. Define required automation or equipment changes and a phased implementation plan.
05
Adjust recipe parameters, setpoints, phase-transition logic, and operating procedures within the agreed scope. Implement required PLC changes, sensor improvements, or targeted equipment modifications.
06
Verify changed recipes using agreed process and hygiene evidence. Compare results with the baseline, document acceptance and remaining actions, and define follow-up monitoring.
WHAT YOU GET
The deliverables connect the current process, identified losses, recommended changes, and cleaning-result verification. Estimated savings are stated with their assumptions; achieved improvements are assessed after implementation. Acceptance limits and production-release rules are agreed with your team according to product risk and project scope.

MAP
Documented cleaning objects, circuits, phases, supply and return paths, instruments, utilities, sampling points, and operating constraints.
KPI
Current cycle duration, resource consumption, rinse quality, and available hygiene indicators by recipe, cleaning object, and phase.
FIND
Process, hygiene, automation, and resource-efficiency opportunities ranked by impact, priority, and recommended corrective action.
REC
Proposed phases, setpoints, operating limits, transition criteria, sampling points, hold/release conditions, and retest requirements.
RESULT
Estimated or verified changes in consumption, wastewater, and downtime, alongside verification results and outstanding validation or corrective actions.
PLAN
A phased plan for recipe updates, automation changes, targeted upgrades, training, and monitoring, with implementation support within the agreed scope.
WHY CIP EXPERTS
01

We connect cleaning recipes with equipment, product soils, flow paths, and the conditions required to achieve the cleaning result.
02

We assess hygiene, process parameters, automation, and resource use together to identify improvements that fit actual production needs.
03

We use process measurements and agreed verification methods to distinguish potential savings from demonstrated performance improvements.
04

We translate findings into prioritised recipe, control, and equipment actions, with a practical path to implementation and verification.
FAQ
Can water and energy use be reduced while maintaining hygiene?
Often, yes. We identify excessive rinsing, heating, and other avoidable consumption, then verify proposed changes against agreed cleaning criteria. The improvement potential depends on the current process and product risks.
Does optimization require replacing the CIP station?
Not necessarily. Improvements may come from recipe adjustments, sensor calibration, revised alarm limits, recovery logic, pump control, and operating procedures. Hardware changes are recommended where the assessment identifies a need.
What information is required to start?
Available PFDs and P&IDs, CIP recipes, cleaning-object lists, product and allergen information, utility tariffs, consumption data, cycle logs, alarms, hygiene results, downtime records, and project goals.
How are optimization results measured?
We compare the baseline and changed process using agreed KPIs such as cycle time, water, energy, chemicals, wastewater, and hygiene results. Comparisons account for relevant differences in products, cleaning objects, and production conditions.
How often should the CIP process be reviewed?
Review frequency should reflect process risk and performance trends. Reassess recipes after product, allergen, equipment, or production changes, recurring deviations, or unexplained consumption increases. A periodic review schedule can be agreed for stable operations.
Do you implement the recommended changes?
Yes. The agreed scope can include recipe fine-tuning, PLC and control-logic changes, sensor improvements, targeted modernization, operator training, and verification after implementation.
Can FlowQeeper support CIP optimization?
Yes. Digital Assistant FlowQeeper can support the review with monitoring dashboards, automatic cycle reports, email notifications, and custom Power BI reports. The scope depends on available data and agreed integration requirements.
Related Pages

Share your CIP recipes, available process data, and improvement goals.
We will define the assessment, measurement, and verification scope.
Thank you for your request!
Our team will contact you soon to discuss your project and the next steps.
Request Sent
Thank you for contacting CIP Experts. Our manager will contact you within one business day.
